NFL Next Gen Stats Explained: Player Tracking, Completion Probability, EPA and More
RedZoneHQ Staff · Sep 9, 2026
NFL Next Gen Stats Explained: Player Tracking, Completion Probability, EPA and More Traditional football statistics tell you what happened. A quarterback completed 24 passes, a receiver gained 112 yards, or a running bac…
NFL Next Gen Stats Explained: Player Tracking, Completion Probability, EPA and More
Traditional football statistics tell you what happened. A quarterback completed 24 passes, a receiver gained 112 yards, or a running back averaged 4.8 yards per carry. Modern football analytics tries to answer a deeper set of questions: How difficult was the throw? How much space did the receiver create? How fast was the ball carrier moving? Was a run successful relative to the down, distance and field position? What did the play contribute to the team's chances of scoring or winning?
The NFL's Next Gen Stats ecosystem has made many of those ideas part of mainstream football discussion. Tracking chips, cameras, machine learning and play-by-play models can turn player movement into information that coaches, broadcasters and fans use to understand performance beyond the box score.
This guide explains the most useful advanced football metrics in plain language, including player tracking, completion probability, expected rushing yards, win probability, EPA-style value concepts and route data. The goal is not to replace film study or traditional statistics. It is to show how different types of information can work together.
What Is NFL Next Gen Stats?
NFL Next Gen Stats uses tracking technology to capture the location and movement of players and the football during games. According to NFL Football Operations, the system tracks information such as location, speed, distance traveled and acceleration, then uses the data to create performance, classification and advanced metrics.
The league explains that its tracking environment supports hundreds of data points on each play and can be used for game analysis, player health and safety, broadcast storytelling and football operations. That is important because “advanced stats” are not one number. They are a family of measurements created from several data sources.
Tracking Data vs. Box-Score Data
Box-score data records discrete outcomes. Tracking data describes movement.
Traditional data
Tracking/advanced data
Passing yards
Time to throw, completion probability, air distance
Rushing yards
Speed, defenders in the box, expected rushing yards
Receptions
Separation, route, target location
Sacks
Pressure time, pass-rush path, protection context
Touchdowns
Win probability and expected-point impact
Both are useful. A receiver with 100 yards had a productive day, but tracking data can help explain whether those yards came from difficult contested catches, separation, yards after catch, scheme-created space or defensive mistakes.
How Player Tracking Works
Tracking systems can measure location, movement, speed and acceleration.
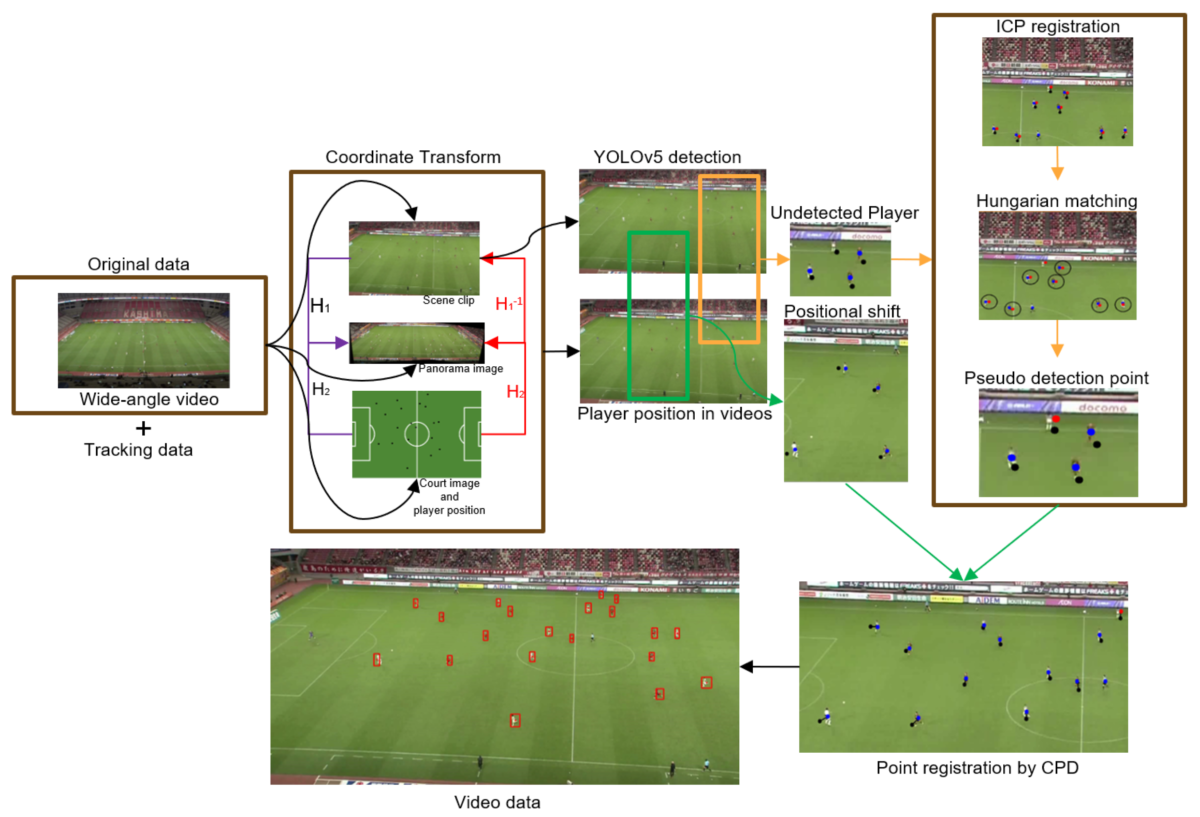
The NFL has used radio-frequency identification and related tracking infrastructure to record player movement. Tags in equipment allow the system to estimate player location repeatedly during a play. Ball tracking adds another layer.
That data can answer questions that were difficult to quantify in the past:
• How fast did a player reach top speed?
• How far did he travel on the play?
• How close was the nearest defender?
• How quickly did the quarterback release the ball?
• How much ground did a safety cover before making a tackle?
• How did a formation change after motion?
Tracking does not automatically explain why a play succeeded. Coaches still need scheme context. But it makes movement measurable.
Completion Probability
Completion probability adds difficulty context to raw completion percentage.
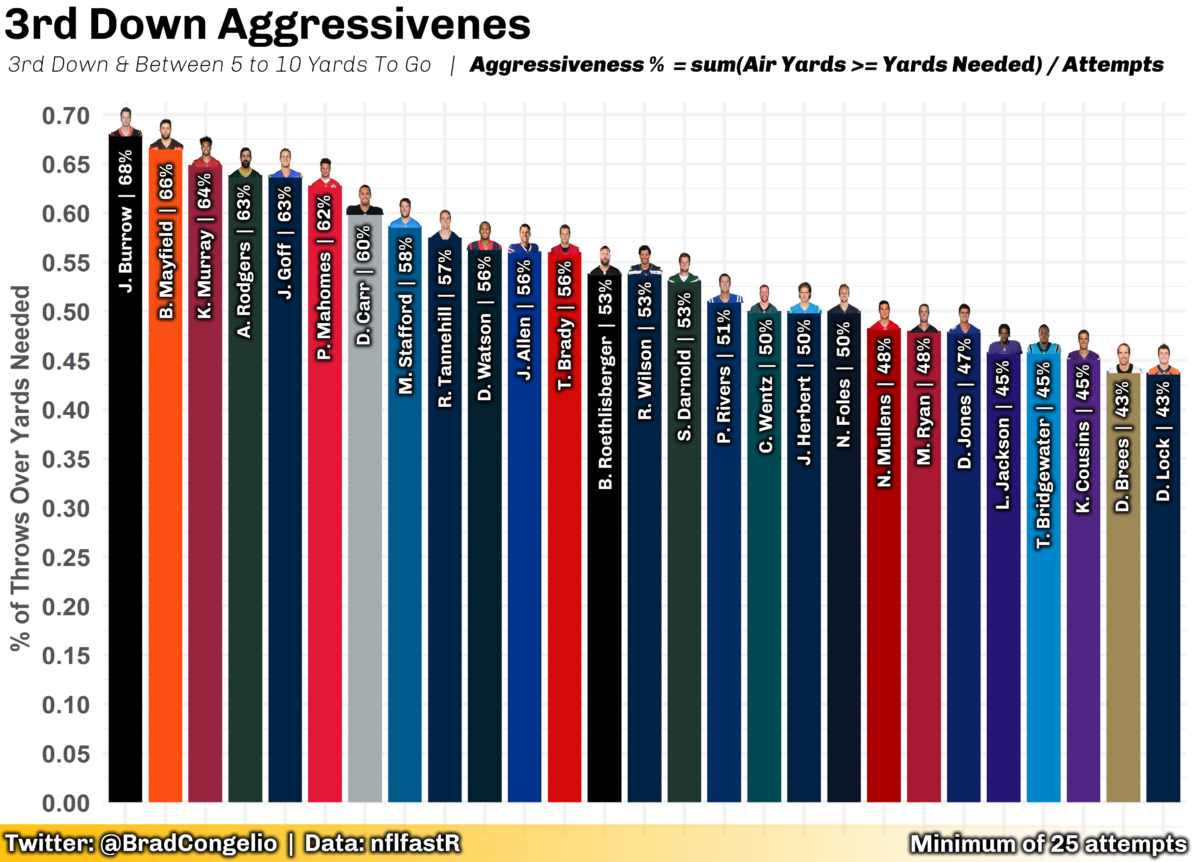
Completion probability estimates how likely a pass is to be completed based on factors that can include throw location, receiver separation, quarterback movement and defensive positioning. The exact model can evolve as technology and data improve, so fans should treat the number as an estimate rather than a law of football.
A short throw to an uncovered running back may carry a high expected completion rate. A deep sideline throw with tight coverage is much more difficult. Comparing actual results with expected difficulty can help identify quarterbacks or receivers who consistently succeed on challenging plays.
Why the context matters
Two quarterbacks can both finish 20-of-30. If one attempted mostly easy throws while the other repeatedly completed low-probability passes, the performances were not identical. Completion probability adds context that raw completion percentage cannot.
Expected Rushing Yards
Expected rushing models compare the blocking picture with the runner's actual result.
Expected rushing models estimate how many yards a runner might be expected to gain based on the blocking picture, defenders, field location and movement around the ball carrier. The difference between expected and actual production can show whether a runner gained more or less than the situation suggested.
This helps separate several components of a rushing play:
• The offensive line may create a large lane.
• The back may avoid an unblocked defender.
• A safety may take a poor pursuit angle.
• The runner may accelerate through a small crease faster than expected.
No single metric perfectly assigns credit, but expected-rushing concepts make the discussion more precise than simply saying a back “wanted it more.”
EPA: Measuring the Value of a Play
Expected Points Added, commonly called EPA, is a play-value framework used widely in football analytics. The basic idea is that every game situation has an estimated scoring value based on field position, down, distance, time and other context. A successful play changes that expectation.
If an offense faces third-and-8 near midfield, its expected scoring outlook is different from first-and-goal at the 2-yard line. Converting the third down can create a large positive swing. Taking a sack can create a negative swing.
A simplified example
Suppose a situation is worth an estimated 1.2 expected points before the play. After a successful gain and first down, the new situation is worth 2.0 expected points. The play created roughly +0.8 expected points of value in simplified terms.
EPA is useful because it understands that ten yards are not equally valuable in every situation. Ten yards on third-and-9 is different from ten yards on third-and-25.
Success Rate
Success rate asks how often an offense creates a positive play relative to the situation. Definitions differ by analytics provider, but the concept is consistent: instead of being overly influenced by a few explosive gains, success rate measures down-to-down efficiency.
A rushing attack might average 5.0 yards per carry because of one 60-yard run while producing many short, unsuccessful runs. Success rate can reveal that inconsistency.
Win Probability
Win probability estimates a team's chance of winning based on score, time, field position, possession and other game-state information. It is most useful as a way to understand leverage.
A routine five-yard gain in the first quarter may barely move win probability. A fourth-down conversion with one minute remaining can create a dramatic swing. The metric helps explain why some plays are far more consequential than their yardage suggests.
Route and Coverage Classification
Tracking data can help classify routes, spacing and defensive coverage patterns.
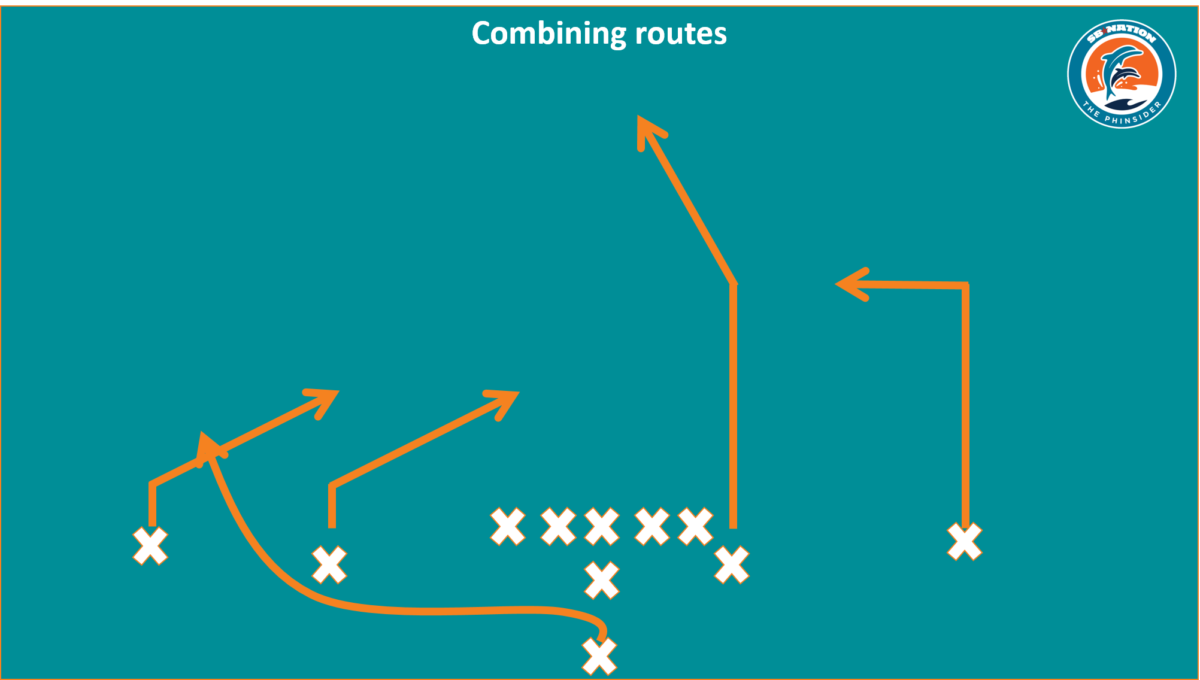
Tracking data can also support route and coverage classification. Modern systems can identify formations, route families and defensive coverage structures. That creates new ways to compare players and schemes.
For example, analysts can ask whether a quarterback performs better against two-high coverage than single-high structures, whether a receiver is particularly productive on crossing routes, or whether a defense uses Cover 4 at an unusually high rate.
Player tracking makes it possible to quantify how often an offense uses motion, how quickly players move and how formations change before the snap. That helps analysts move beyond vague descriptions such as “this team uses a lot of motion.”
Motion can be connected to passing efficiency, rushing efficiency or defensive response. It does not prove that motion caused every successful play, but it can show meaningful patterns across hundreds of snaps.
Sacks are a blunt measure of pass rush. A defender can dominate a play without recording a sack by forcing the quarterback to move, throw early or abandon the first read. Tracking and charting data help measure pressure more directly.
Useful pass-rush questions include:
• How quickly did pressure arrive?
• Was the rusher chipped?
• Did the quarterback hold the ball unusually long?
Analytics can support game planning and evaluation when combined with film context.
Analytics can support several parts of football operations.
Game planning
Coaches can study tendencies by formation, coverage, down and personnel. Data can help identify patterns worth investigating on film.
Player evaluation
Scouts and analysts can combine traditional grading with tracking information to understand speed, separation, pressure, tackling angles and other performance traits.
Fourth-down decisions
Expected-value models can help coaches think about when to punt, kick or attempt a conversion. The final decision still includes opponent, weather, personnel and game flow.
Health and workload
Tracking distance, acceleration and other movement measures can contribute to workload discussions. Medical and performance staffs must use such information responsibly and protect player privacy.
What Advanced Stats Cannot Tell You Alone
Numbers need context. A metric may show that a quarterback had a low completion probability on several throws, but film may reveal whether the receiver ran the correct route. A running back may gain fewer yards than expected because the play design required him to protect the ball late in a game. A cornerback may allow a completion because the coverage intentionally conceded a short throw.
Useful analysis combines data with understanding of assignment, score, opponent and situation.
Common Analytics Mistakes
• Treating one metric as a complete ranking. Football performance is multidimensional.
• Ignoring sample size. A few plays can create extreme numbers.
• Confusing correlation with cause. A team may use more motion when healthy, for example, so motion alone may not explain the improvement.
• Comparing different definitions. Providers may calculate pressure, success rate or expected points differently.
• Ignoring role. Players asked to perform different jobs should not always be compared directly.
A Fan-Friendly Analytics Checklist
When you see an advanced statistic during a broadcast, ask five questions:
1. What exactly is being measured?
2. Is it an outcome, an expectation or a tracking measurement?
3. What is the sample size?
4. What football context might affect the number?
#5Does film or game flow support the same conclusion?
Those questions prevent advanced metrics from becoming empty jargon.
Frequently Asked Questions
Are Next Gen Stats available to fans?
The NFL publishes many Next Gen Stats through NFL.com, broadcasts and league products, although teams and league partners can have access to deeper data sets and tools.
Is EPA an official NFL stat?
EPA is an analytics concept used across football data ecosystems rather than a traditional box-score category. Different providers may use different models, so values should be compared within the same source whenever possible.
Can analytics replace scouting?
No. Analytics can identify patterns and provide context, while scouting and film study explain technique, assignment and decision-making. The strongest evaluation combines both.
Why do advanced stats sometimes disagree?
Models can use different inputs, definitions and assumptions. Disagreement does not necessarily mean one is useless; it means the methodology matters.
Conclusion
NFL analytics is most valuable when it makes football easier to understand rather than more complicated. Tracking data explains movement, probability models describe difficulty, EPA-style measures add situational value and route or coverage classification reveals schematic patterns.
The important lesson is not to replace the box score with a new set of numbers. It is to add context. A 20-yard completion becomes more informative when you know the coverage, separation, pressure and probability of success. A five-yard run can be excellent if the blocking offered almost nothing. In 2026, fans have access to more football information than ever. Learning what the metrics actually mean is the best way to use that information without losing sight of the game itself.